5.1: Areas and Distances
Here we go with Section 5.1, also known as finding the area on confusing graphs.
The first thing we talked about in class was how to find areas of different geometrical shapes. Of course, we can easily find the area of a triangle or a circle. But wait...how do we find the area of this graph?

Well let's take a look at a more specific example: estimate the area under the parabola y=x^2 from 2 to 4.

Well, we can't use a big triangle to find the area of this parabola because then the hypotenuse side would be curved. And sry Kate, we can't just not do the problem. But we can use rectangles! So let's divide the graph into four different strips (S1, S2, S3 and S4) by drawing vertical lines at x=2.5, x=3 and x=3.5.

Then if we make each of the strips rectangles, they will each have a base of 0.5. The parabola will look like this:
 Now we can use these rectangles to estimate the area of the parabola. We know that the width of each rectangle is 0.5. The height is the y-value at each x coordinate. Therefore the heights are (2.5)^2, (3)^2, (3.5)^2 and (4)^2 respectively.
Let's use L4 to represent the sum of the areas of these rectangles.
L4 = (0.5)(6.25) + (0.5)(9) + (0.5)(12.25) + (0.5)(16)
L4 = 21.75
*Note that we don't include 2 as a height, because we can't find the y-value since it is not on the curve.*
However, part of the rectangles are drawn outside of the parabola. Therefore, the exact area of this parabola must be less than 21.75. If we make the rectangles smaller, we can find what the area has to be greater than.

Here the heights are (2)^2, (2.5)^2, (3)^2 and (3.5)^2 respectively.
Let's use R4 to represent the sum of the area of these rectangles.
R4 = (0.5)(4) + (0.5)(6.25) + (0.5)(9) + (0.5)(12.25)
R4 = 15.75
*Be careful NOT to inculude (4)^2 in the heights because the point (4, 16) is outside the rectangle.*
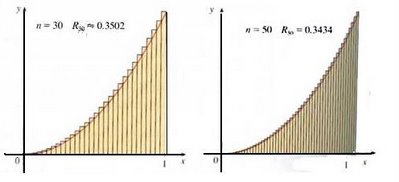
Therefore the area is greater than 15.75, but less than 21.75. If use the same parabola but generalize the interval, we can show that the sum of the areas of the rectangles approach 1/3.
The graph would be:
 Each rectangle has a width of 1/n and the heights are the values of f(x)=x^2 at the points 1/n, 2/n, 3/n... The heights are (1/n)^2, (2/n)^2...
R4 = (1/n)(1/n)^2 + (1/n)(2/n)^2 + ......+ (1/n)(n/n)^2 R4 = (1/n)(1/n^2)(1^2 + 2^2 + 3^2+......+ n^2) R4 = (1/n^3)(1^2 + 2^2 + 3^2+......+ n^2)
We can use the formula for the sum of the squares of the first n positive integers:
1^2 + 2^2 +.....+n^2 = n(n+1)(2n+1)/6
After we substitute this expression for limit of Rn, we get: 
If you think really really hard, you'll realize that if we keep on decreasing the width of the rectangles, the heights will eventually match the curve. Take a look:
The width of each rectangle in the interval [a,b] is b-a. The formula is:
Defintion: The area A of the region S that lies under the graph of the continuous function f is the limit of the sum of the areas of approximating rectangles:
Alright. Now that we know the formulas, let's try a problem. Find the area under the graph of f(x) = sin x between x = 0 and x = 1.
 1) Find width
2) Estimate the area by taking the sample points to be midpoints & use 4 subintervals.
1) Since a=0 and a=1, the width is: 
x1 = 1/n, x2 = 2/n, x3=3/n, xi=1i/n. The sum is:
2) n= 4 because we have 4 approximating rectangles. Therefore the width is: 
Subintervals: [0, .25], [.25, .5], [.5, .75], [.75,1]
Finally we can calculate the sum:
The distance problem. Remember this equation: distance = velocity x time??? of course
But what if the velocity is hard to find? Well then we can find the area of the function! We simply make a table with our x-value as time and our y-value as velocity. (just like on pg. 376)
Now i bet you guys got lost back at the colorful graphs. Well no worries because this site is awesome. There are like 9 pages of explanations on how to find the area of any curve. http://www.ugrad.math.ubc.ca/coursedoc/math101/notes/integration/area.html GO CHECK IT OUT! This site is good too: http://www.counton.org/alevel/pure/purtutintcur.htm
Kristin H! I believe you are up next!
Now for some Chistmas PUNS!: Which elf sings "Love me tender?" Santa's little Elvis!
Oh and this is just funny:


1 Comments:
Hey everyone. Sorry, i think i included more information in this blog that i needed to, or that i could handle. so i probably explained the midpoint rule in a complicated way. Let's put it into simpler terms: first we should find how many rectangles we are going to divide the rectangle into. then set that number equal to n and plug it into the equation to find the width of the rectangles. Then find the midpoint between the lower boundary point and the delta x. Then to find the other midpoints, simply add the delta x value each time.
Ok hopefully that cleared it up a little bit. Have funnn.
Post a Comment
<< Home