4.5: Summary of Curve Sketching
'Ello, all! God willing, this will be a fairly short post, because, as the title should hint, this section is little more than a "summary" of the previous sections. While 4.1-4.4 laid down the guidelines to drawing and identifying graphs, 4.5 condenses thes guidelines into a nice, easy checklist. Ready for it? Okay:
When sketching a curve...
- Determine the Domain - It's really helpful to start out knowing where x is and is not defined, so do that first--it'll lay the groundwork for everything else.
- Determine the x and y intercepts - first, find the y-intercept by plugging in 0 for x. Then, solve for x when f(x) = 0, if the equation isn't too difficult to do so fairly quickly.
- Determine the symmetry - There are three types of symmetrical functions: even functions, odd functions, and periodic functions. Even functions occur when f(x) = f(-x) and are symmetrical about the y-axis (like cosine graphs and even power functions). If we have an even function, our work is cut in half. We only have to determine the shape of the curve when x is positive. Then we reflect it across the axis and voila! Odd functions, like sine and odd power graphs, occur when f(x) = -f(x) and are symmetrical about the origin. Thus, when dealing with odd functions, we simply determine the shape of the graph when x is positive, then rotate it 180 degrees about the origin. Periodic functions, occur when f(x + p) = f(x) where p is a positive constant called the period. With this graph, we simply have to know what the graph looks like for one interval of length p. Then we can translate that interval to sketch the entire graph. Both sine and cosine graphs are periodic.
- Find the asymptotes - The three types of asymptotes (only two of which we have seen before) are: horizontal asymptotes, vertical asymptotes, and slant asymptotes. A review of asymptotes can be found in 2.6. Find and draw in the asymptotes.
- Test for intervals of increase and decrease - To compute intervals of increase and decrese, you need the I/D test, or first derivative test. Find the intervals at which f ' is positive to determine when x is increasing and find the intervals at which f ' is negative to determine when x is decreasing.
- Calculate local maximums and minimums - By the same first derivative test, you can find the value for which f ' = 0 and note wheter the value is going from negative to positive (minimum) or positive to negative (maximum) or not changing signs (neither local max nor min).
- Find concavity and points of inflection (POI) - Use the second derivative test to dertermine concavity. When f " is greater than 0, the graph is concave upward, and when f " is less than 0, the graph is concave downward. The point at which f " changes from concave up to concave down (or vice versa) is the POI.
- SKETCH! - once you've figured out all this information, DRAW away!
Okay, so there's the checklist. Now, let's walk through it with some real numbers. Here's the problem:

Step 1 - Domain/Undefined Values: x is undefined at +/- 1
Step 2 - X/Y Intercepts: the x and y intercepts are both 0
Step 3 - Symmetry: f(-x) = f(x), so the curve is even, which means it is symmetric about the y-axis.
Step 4 - Horizontal and Vertical Asymptotes: this function has both horizontal and vertical asymptotes.
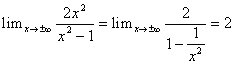
SO, y = 2 is a horizontal asymptote. Now let's look at vertical asymptotes: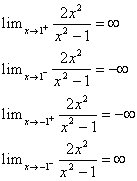
This means that x =1 and x = -1 are vertical asymptotes.
Step 5 - Intervals of Increase and Decrease: Using the first derivative test, we find...
Since f '(x) is greater than 0 when x is less than 0 (and not equal to -1!), and f '(x) is less than 0 when x is greater than 0 (and not equal to 1!), it can be determined that f (x) is increasing between negative infinity and -1, and between -1 and 0, and is increasing between 0 and 1, and 1 and infinity.
Step 6 - Local Maximums and Minimums: f ' (x) changes from positive to negative at 0 and only 0, so that is the only critical number. It is determined, by the first derivative test, that it is also the local maximum.
Step 7 - Concavity and Points of Inflection: 
Thus, the curve is concave upward between negative infinity and -1 and between 1 and infinity, and concave downward between -1 and 1. Because 1 and -1 are not in f's domain, it has no points of inflection.
Step 8 - SKETCH!: now, take all of the bolded conclusions drawn from the previous 7 steps and sketch a graph that works with those conclusions. Got it? Good!
For more practice or a second opinion, a this is a great site.
Yay for short blogs! Actually, it got rather long, didn't it? Long but all summary, a nice simple section. Have a nice weekend, you guys!

I can't help but wonder... was this what Mr. French was like when he was little?
Your turn, MARK!
posted by AbbeySomething @ 2:19 PM
2 comments
![]()
![]()

2 Comments:
No, no, no. I was much more "radical"...
THANK YOU :-D, i needed this
Post a Comment
<< Home